Trading Demonstrations
TradeProfina works for all markets: stocks, ETFs, futures, options, currencies, and more.
Click on any demo below to see real trading results. For intraday trading demo, click here.
Publication Date: 2025-07-03
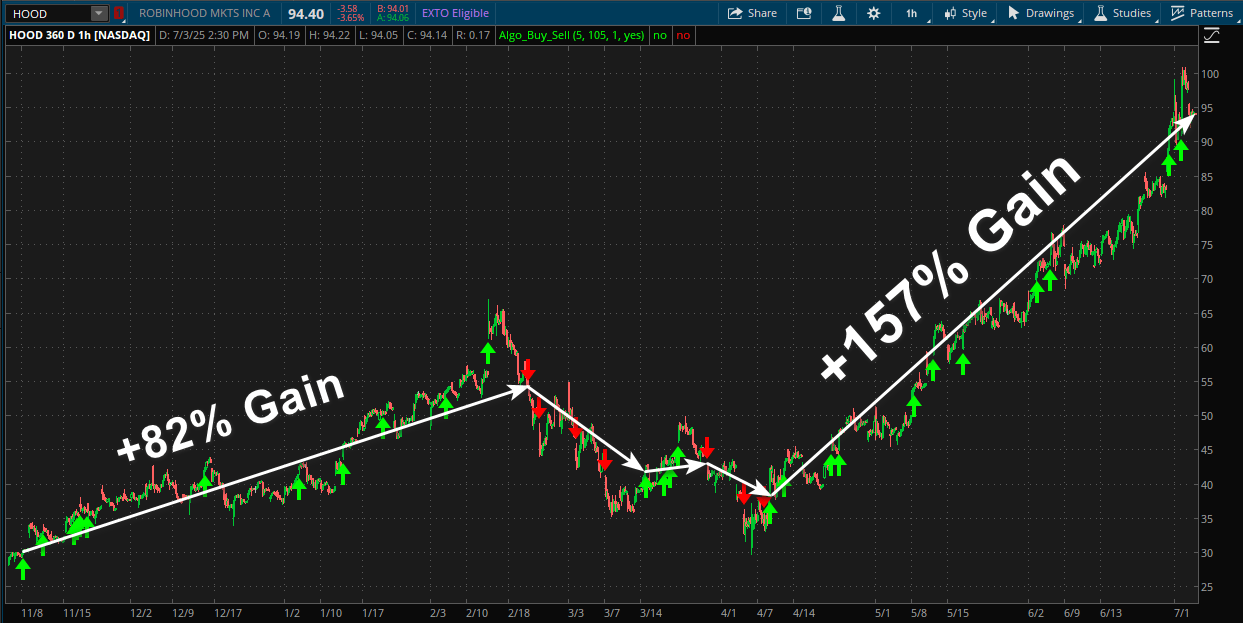
Roobin Hood (HOOD)
How to read the chart?
Buy signal = arrow-up in green. Sell signal = arrow-down in red. The signals can be used for both entry and exit.
Strategy is pretty simple - buy at the first buy signal after one or multiple sell signals, and sell at the first sell signal after one or multiple buy signals.
Trade for both directions - long and short.
Each trade is marked with a white or yellow line with an arrow. The beginning of the line is the entry point and the end of the line is the exit point.
Winning trade = white line with an arrow. Losing trade = yellow line with an arrow.
| Symbol | Time Frame | Start Date | End Date | Trading Days | Total Trades | Winning Trades | Overall Profits | Equivalent Yearly Profits |
|---|---|---|---|---|---|---|---|---|
| HOOD | 1 hour | 2024-11-10 | 2025-07-02 | 159 | 5 | 5 | +489% | +735% |
Publication Date: 2025-07-03
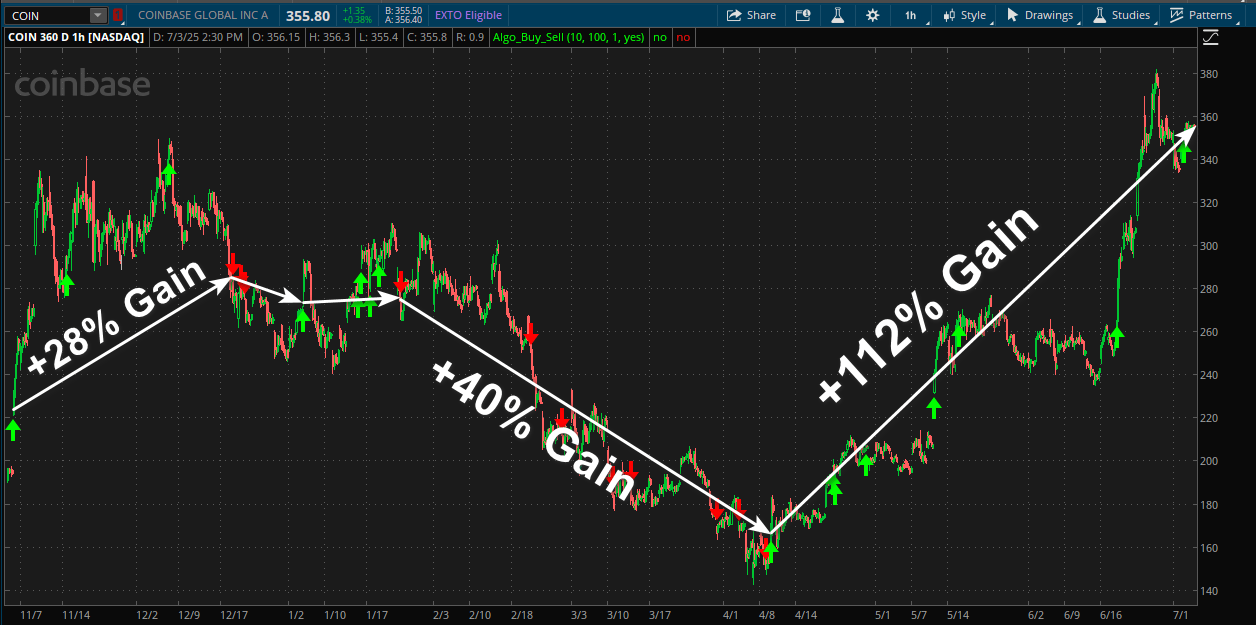
Coinbase (COIN)
How to read the chart?
Buy signal = arrow-up in green. Sell signal = arrow-down in red. The signals can be used for both entry and exit.
Strategy is pretty simple - buy at the first buy signal after one or multiple sell signals, and sell at the first sell signal after one or multiple buy signals.
Trade for both directions - long and short.
Each trade is marked with a white or yellow line with an arrow. The beginning of the line is the entry point and the end of the line is the exit point.
Winning trade = white line with an arrow. Losing trade = yellow line with an arrow.
| Symbol | Time Frame | Start Date | End Date | Trading Days | Total Trades | Winning Trades | Overall Profits | Equivalent Yearly Profits |
|---|---|---|---|---|---|---|---|---|
| COIN | 1 hour | 2024-11-10 | 2025-07-02 | 159 | 5 | 5 | +288% | +408% |
Publication Date: 2025-07-03
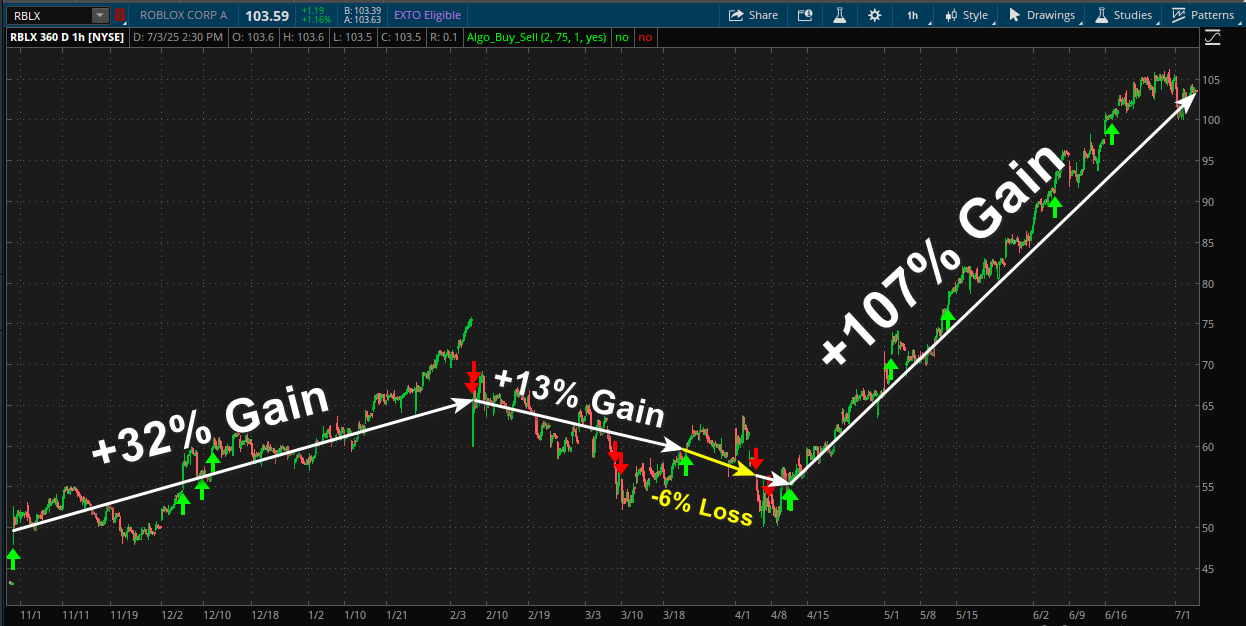
Roblox (RBLX)
How to read the chart?
Buy signal = arrow-up in green. Sell signal = arrow-down in red. The signals can be used for both entry and exit.
Strategy is pretty simple - buy at the first buy signal after one or multiple sell signals, and sell at the first sell signal after one or multiple buy signals.
Trade for both directions - long and short.
Each trade is marked with a white or yellow line with an arrow. The beginning of the line is the entry point and the end of the line is the exit point.
Winning trade = white line with an arrow. Losing trade = yellow line with an arrow.
| Symbol | Time Frame | Start Date | End Date | Trading Days | Total Trades | Winning Trades | Overall Profits | Equivalent Yearly Profits |
|---|---|---|---|---|---|---|---|---|
| RBLX | 1 hour | 2024-11-10 | 2025-07-02 | 159 | 5 | 4 | +205% | +292% |
Publication Date: 2025-07-03
Vertiv (VRT)
How to read the chart?
Buy signal = arrow-up in green. Sell signal = arrow-down in red. The signals can be used for both entry and exit.
Strategy is pretty simple - buy at the first buy signal after one or multiple sell signals, and sell at the first sell signal after one or multiple buy signals.
Trade for both directions - long and short.
Each trade is marked with a white or yellow line with an arrow. The beginning of the line is the entry point and the end of the line is the exit point.
Winning trade = white line with an arrow. Losing trade = yellow line with an arrow.
| Symbol | Time Frame | Start Date | End Date | Trading Days | Total Trades | Winning Trades | Overall Profits | Equivalent Yearly Profits |
|---|---|---|---|---|---|---|---|---|
| VRT | 30 minutes | 2025-02-14 | 2025-07-02 | 105 | 4 | 3 | +182% | +390% |

Publication Date: 2024-11-21
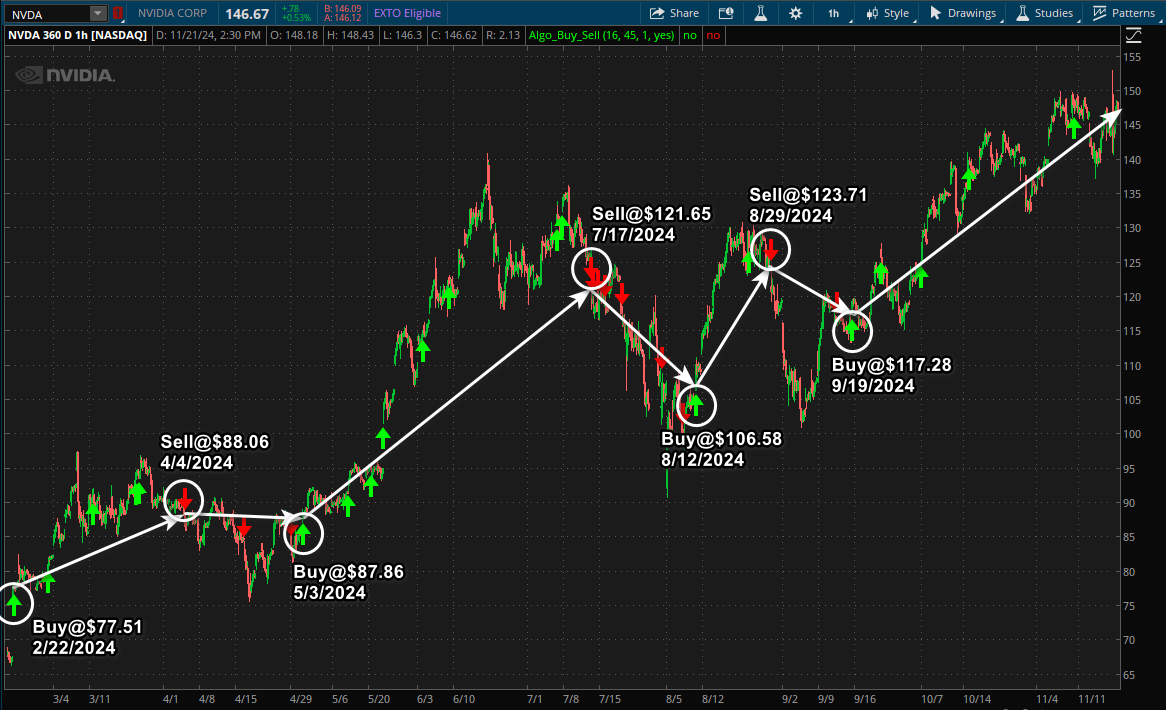
NVIDIA Corp (NVDA)
How to read the chart?
Buy signal = arrow-up in green. Sell signal = arrow-down in red. The signals can be used for both entry and exit.
Strategy is pretty simple - buy at the first buy signal after one or multiple sell signals, and sell at the first sell signal after one or multiple buy signals.
Trade for both directions - long and short.
Each trade is marked with a white or yellow line with an arrow. The beginning of the line is the entry point and the end of the line is the exit point.
Winning trade = white line with an arrow. Losing trade = yellow line with an arrow.
| Symbol | Time Frame | Start Date | End Date | Trading Days | Total Trades | Winning Trades | Overall Profits | Equivalent Yearly Profits |
|---|---|---|---|---|---|---|---|---|
| NVDA | 1 hour | 2024-02-22 | 2024-11-21 | 188 | 7 | 7 | +137% | +183% |
Publication Date: 2024-10-23
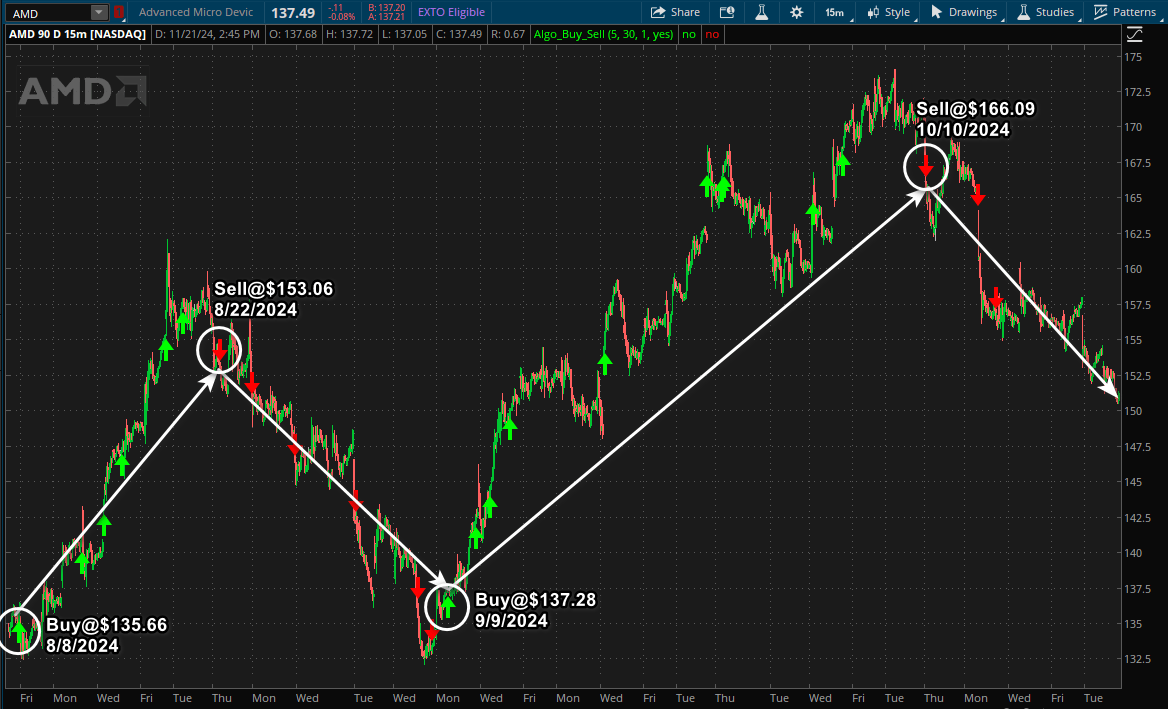
Advanced Micro Devices (AMD)
How to read the chart?
Buy signal = arrow-up in green. Sell signal = arrow-down in red. The signals can be used for both entry and exit.
Strategy is pretty simple - buy at the first buy signal after one or multiple sell signals, and sell at the first sell signal after one or multiple buy signals.
Trade for both directions - long and short.
Each trade is marked with a white or yellow line with an arrow. The beginning of the line is the entry point and the end of the line is the exit point.
Winning trade = white line with an arrow. Losing trade = yellow line with an arrow.
| Symbol | Time Frame | Start Date | End Date | Trading Days | Total Trades | Winning Trades | Overall Profits | Equivalent Yearly Profits |
|---|---|---|---|---|---|---|---|---|
| AMD | 15 mins | 2024-08-08 | 2024-10-23 | 52 | 4 | 4 | +56% | +568% |
Publication Date: 2024-10-07
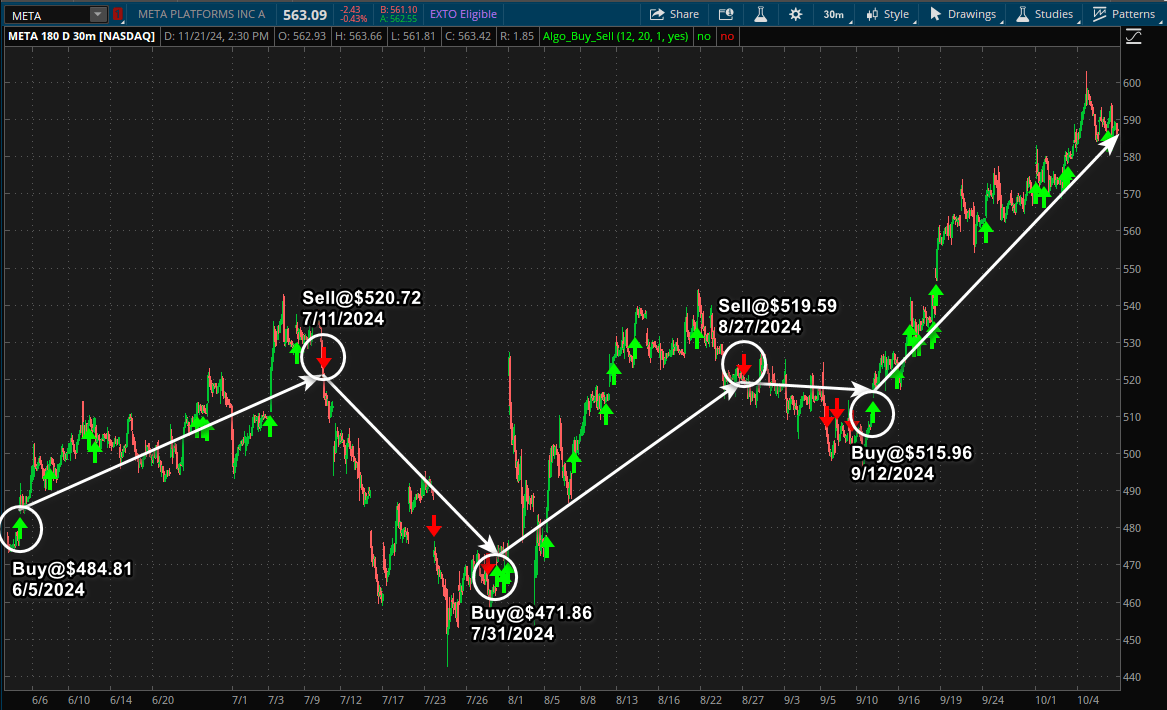
Meta Platforms Inc (META)
How to read the chart?
Buy signal = arrow-up in green. Sell signal = arrow-down in red. The signals can be used for both entry and exit.
Strategy is pretty simple - buy at the first buy signal after one or multiple sell signals, and sell at the first sell signal after one or multiple buy signals.
Trade for both directions - long and short.
Each trade is marked with a white or yellow line with an arrow. The beginning of the line is the entry point and the end of the line is the exit point.
Winning trade = white line with an arrow. Losing trade = yellow line with an arrow.
| Symbol | Time Frame | Start Date | End Date | Trading Days | Total Trades | Winning Trades | Overall Profits | Equivalent Yearly Profits |
|---|---|---|---|---|---|---|---|---|
| META | 30 mins | 2024-06-05 | 2024-10-07 | 85 | 5 | 5 | +45% | +202% |
Publication Date: 2024-07-06
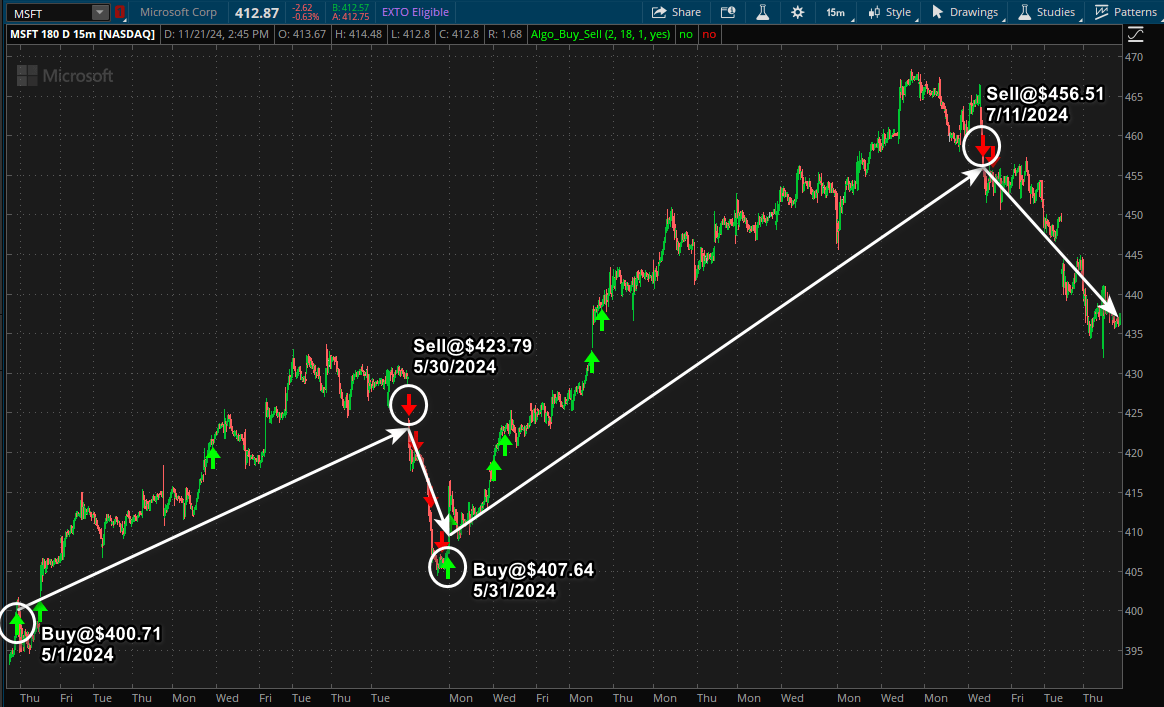
Microsoft Corp (MSFT)
How to read the chart?
Buy signal = arrow-up in green. Sell signal = arrow-down in red. The signals can be used for both entry and exit.
Strategy is pretty simple - buy at the first buy signal after one or multiple sell signals, and sell at the first sell signal after one or multiple buy signals.
Trade for both directions - long and short.
Each trade is marked with a white or yellow line with an arrow. The beginning of the line is the entry point and the end of the line is the exit point.
Winning trade = white line with an arrow. Losing trade = yellow line with an arrow.
| Symbol | Time Frame | Start Date | End Date | Trading Days | Total Trades | Winning Trades | Overall Profits | Equivalent Yearly Profits |
|---|---|---|---|---|---|---|---|---|
| MSFT | 15 mins | 2024-05-01 | 2024-07-16 | 52 | 4 | 4 | +26% | +198% |
Publication Date: 2023-11-15
S&P 500 Index ETF (SPY)
How to read the chart?
Buy signal = arrow-up in green. Sell signal = arrow-down in red. The signals can be used for both entry and exit.
Strategy is pretty simple - buy at the first buy signal after one or multiple sell signals, and sell at the first sell signal after one or multiple buy signals.
Trade for both directions - long and short.
Each trade is marked with a white or yellow line with an arrow. The beginning of the line is the entry point and the end of the line is the exit point.
Winning trade = white line with an arrow. Losing trade = yellow line with an arrow.
| Symbol | Time Frame | Start Date | End Date | Trading Days | Total Trades | Winning Trades | Overall Profits | Equivalent Yearly Profits |
|---|---|---|---|---|---|---|---|---|
| SPY | 15 mins | 2023-08-28 | 2023-11-15 | 64 | 4 | 4 | +13.4% | +53% |

Publication Date: 2023-11-15
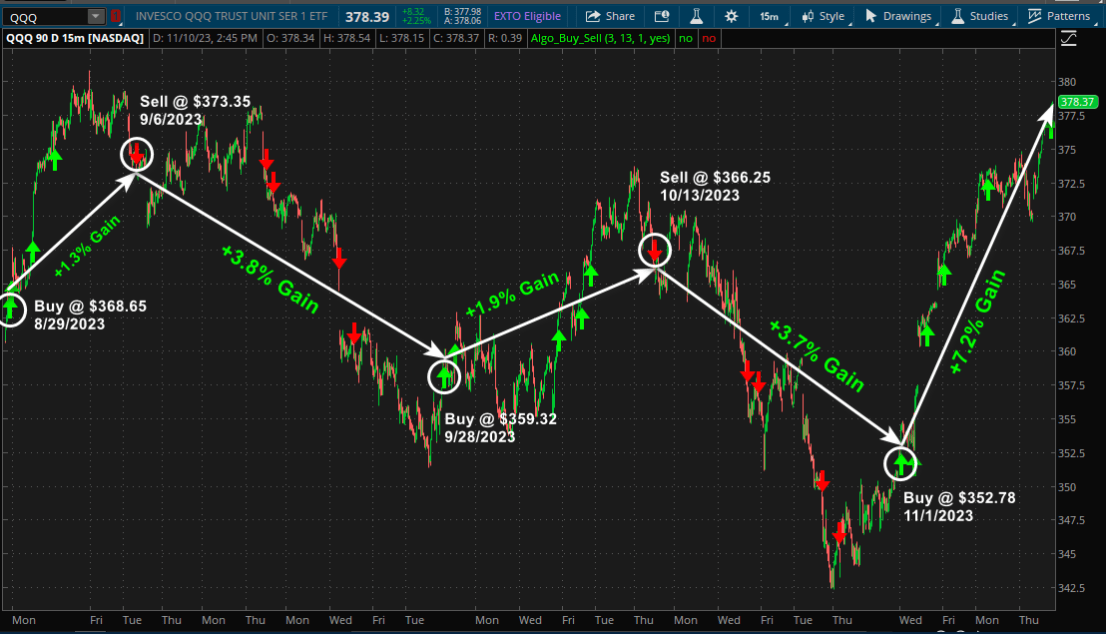
Nasdaq 100 Index ETF (QQQ)
How to read the chart?
Buy signal = arrow-up in green. Sell signal = arrow-down in red. The signals can be used for both entry and exit.
Strategy is pretty simple - buy at the first buy signal after one or multiple sell signals, and sell at the first sell signal after one or multiple buy signals.
Trade for both directions - long and short.
Each trade is marked with a white or yellow line with an arrow. The beginning of the line is the entry point and the end of the line is the exit point.
Winning trade = white line with an arrow. Losing trade = yellow line with an arrow.
| Symbol | Time Frame | Start Date | End Date | Trading Days | Total Trades | Winning Trades | Overall Profits | Equivalent Yearly Profits |
|---|---|---|---|---|---|---|---|---|
| QQQ | 15 mins | 2023-08-28 | 2023-11-15 | 64 | 5 | 5 | +19% | +75% |
Publication Date: 2023-11-15
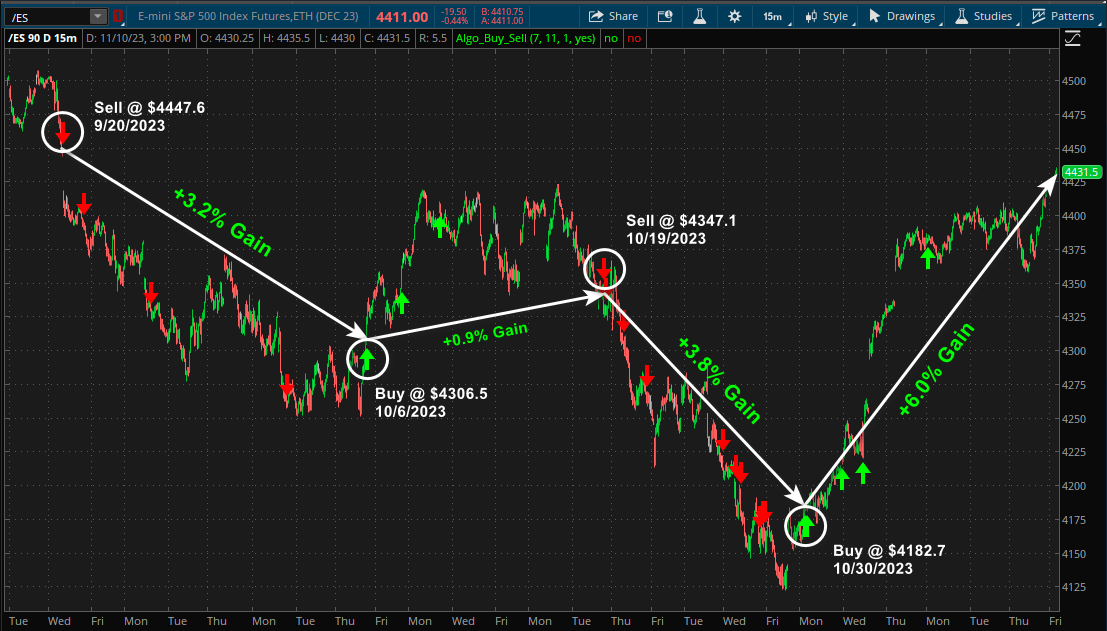
E-Mini S&P 500 Futures (ES)
How to read the chart?
Buy signal = arrow-up in green. Sell signal = arrow-down in red. The signals can be used for both entry and exit.
Strategy is pretty simple - buy at the first buy signal after one or multiple sell signals, and sell at the first sell signal after one or multiple buy signals.
Trade for both directions - long and short.
Each trade is marked with a white or yellow line with an arrow. The beginning of the line is the entry point and the end of the line is the exit point.
Winning trade = white line with an arrow. Losing trade = yellow line with an arrow.
| Symbol | Time Frame | Start Date | End Date | Trading Days | Total Trades | Winning Trades | Overall Profits | Equivalent Yearly Profits |
|---|---|---|---|---|---|---|---|---|
| ES | 15 mins | 2023-08-28 | 2023-11-15 | 64 | 4 | 4 | +14.6% | +58% |
Publication Date: 2023-11-15
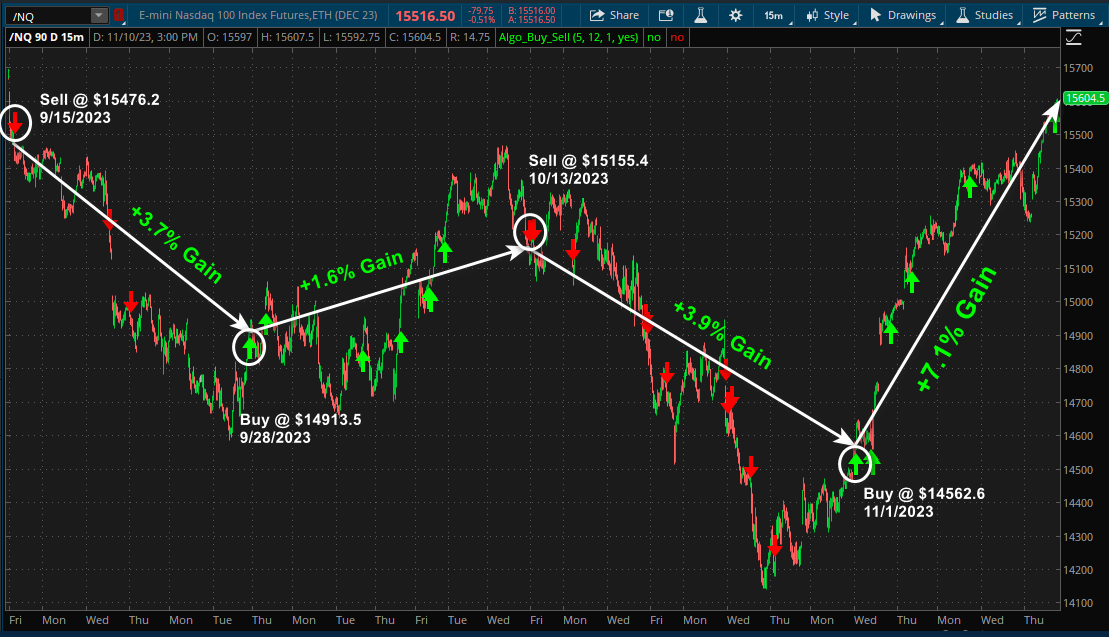
E-Mini Nasdaq 100 Futures (NQ)
How to read the chart?
Buy signal = arrow-up in green. Sell signal = arrow-down in red. The signals can be used for both entry and exit.
Strategy is pretty simple - buy at the first buy signal after one or multiple sell signals, and sell at the first sell signal after one or multiple buy signals.
Trade for both directions - long and short.
Each trade is marked with a white or yellow line with an arrow. The beginning of the line is the entry point and the end of the line is the exit point.
Winning trade = white line with an arrow. Losing trade = yellow line with an arrow.
| Symbol | Time Frame | Start Date | End Date | Trading Days | Total Trades | Winning Trades | Overall Profits | Equivalent Yearly Profits |
|---|---|---|---|---|---|---|---|---|
| ES | 15 mins | 2023-08-28 | 2023-11-15 | 64 | 4 | 4 | +17.2% | +68% |
Publication Date: 2023-11-15
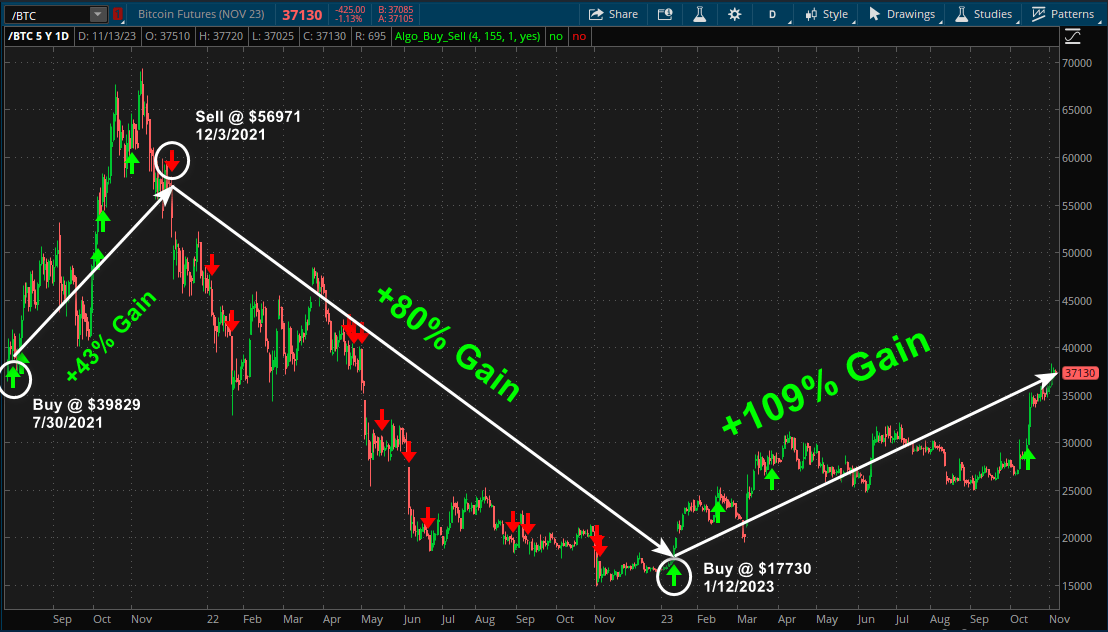
BTC
How to read the chart?
Buy signal = arrow-up in green. Sell signal = arrow-down in red. The signals can be used for both entry and exit.
Strategy is pretty simple - buy at the first buy signal after one or multiple sell signals, and sell at the first sell signal after one or multiple buy signals.
Trade for both directions - long and short.
Each trade is marked with a white or yellow line with an arrow. The beginning of the line is the entry point and the end of the line is the exit point.
Winning trade = white line with an arrow. Losing trade = yellow line with an arrow.
| Symbol | Time Frame | Start Date | End Date | Trading Days | Total Trades | Winning Trades | Overall Profits | Equivalent Yearly Profits |
|---|---|---|---|---|---|---|---|---|
| BTC | 1 day | 2021-07-28 | 2023-11-15 | 586 | 3 | 3 | +442% | +190% |
Publication Date: 2023-11-15
USD / JPY
How to read the chart?
Buy signal = arrow-up in green. Sell signal = arrow-down in red. The signals can be used for both entry and exit.
Strategy is pretty simple - buy at the first buy signal after one or multiple sell signals, and sell at the first sell signal after one or multiple buy signals.
Trade for both directions - long and short.
Each trade is marked with a white or yellow line with an arrow. The beginning of the line is the entry point and the end of the line is the exit point.
Winning trade = white line with an arrow. Losing trade = yellow line with an arrow.
| Symbol | Time Frame | Start Date | End Date | Trading Days | Total Trades | Winning Trades | Overall Profits | Equivalent Yearly Profits |
|---|---|---|---|---|---|---|---|---|
| USD / JPY | 30 min | 2023-10-11 | 2023-11-15 | 24 | 7 | 6 | 903 pips | 9,481 pips |


